Dental ultrasound
Why ultrasound: more precise where it matters, and no radiation
Dentistry adopted X-rays a century ago because nothing else could see through enamel. Peer-reviewed studies now show ultrasound measuring bone, gums and early decay to a fraction of a millimeter, with zero ionizing dose.
Side by side
What a camera sees. What ultrasound is designed to see.
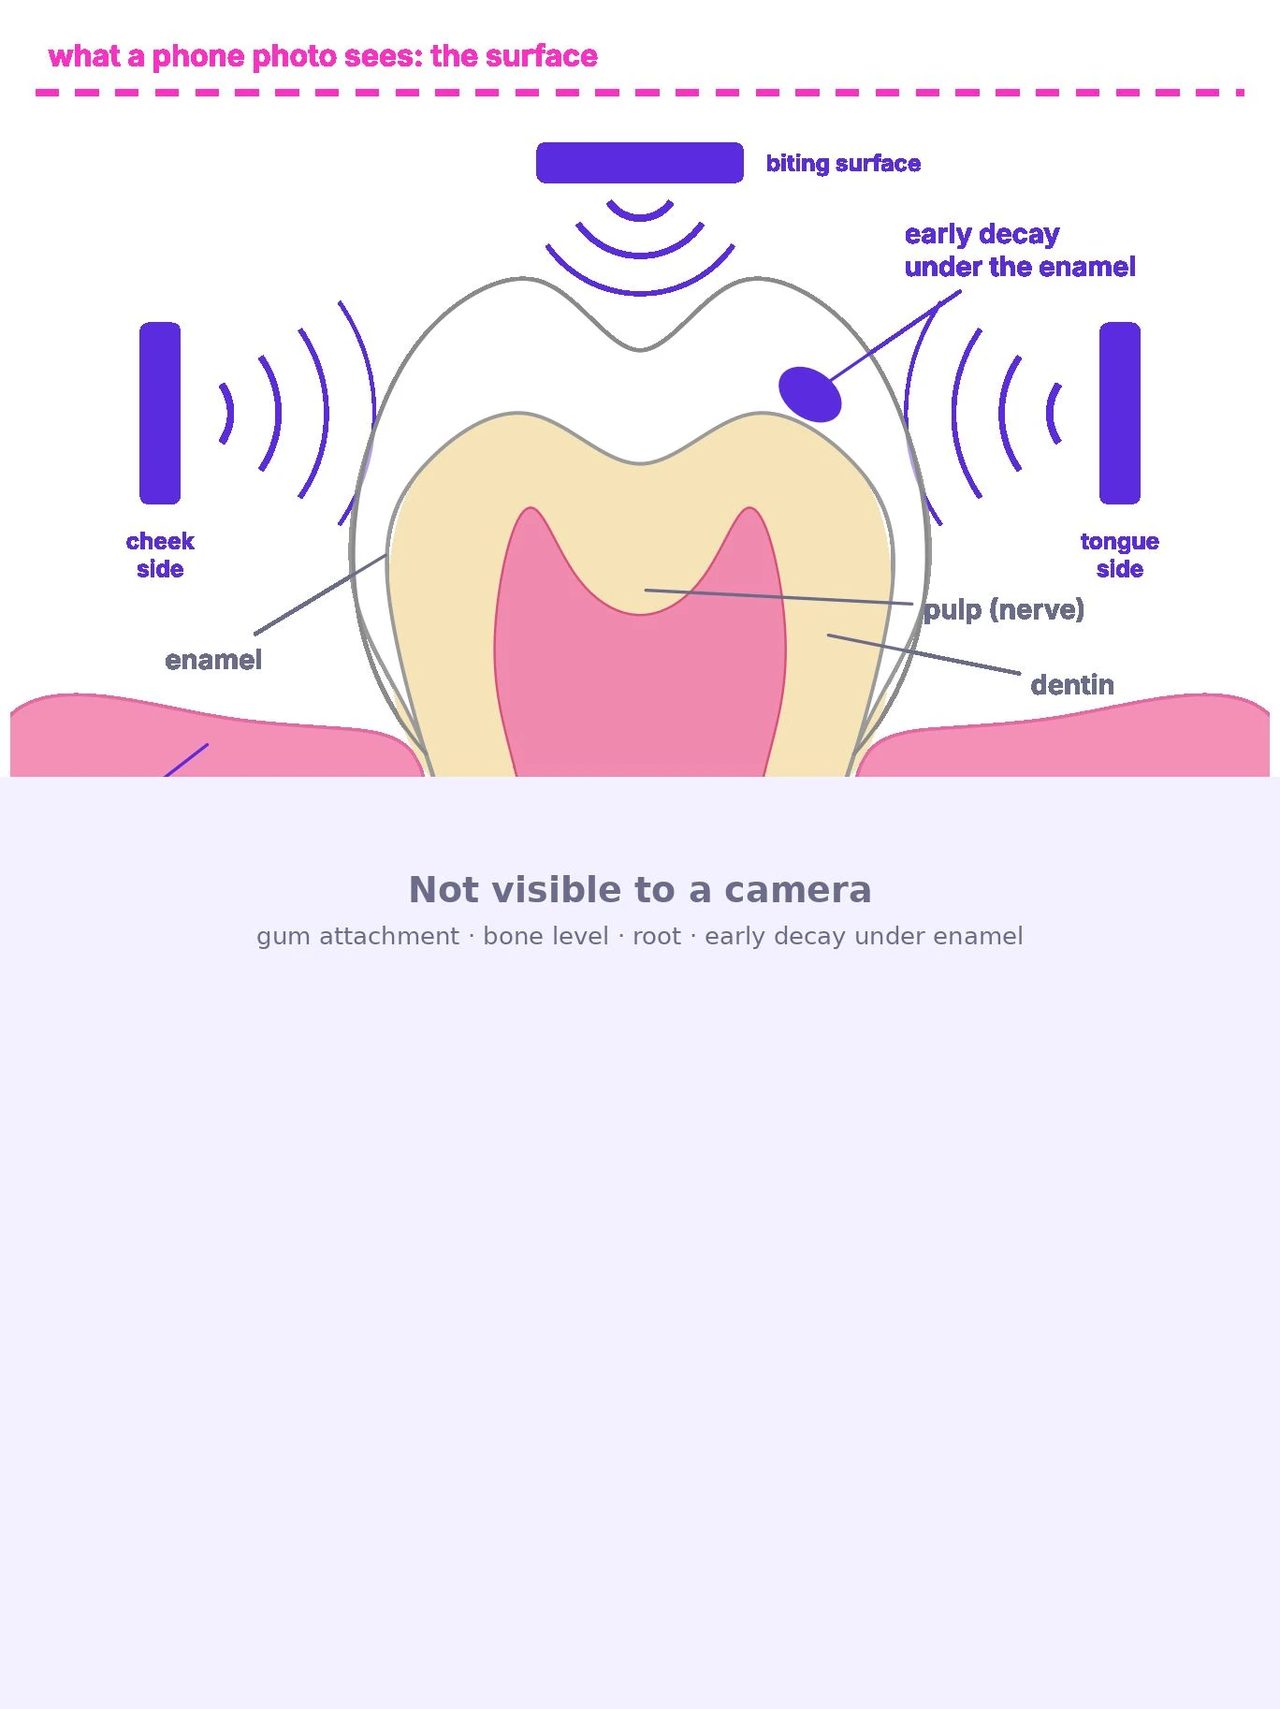
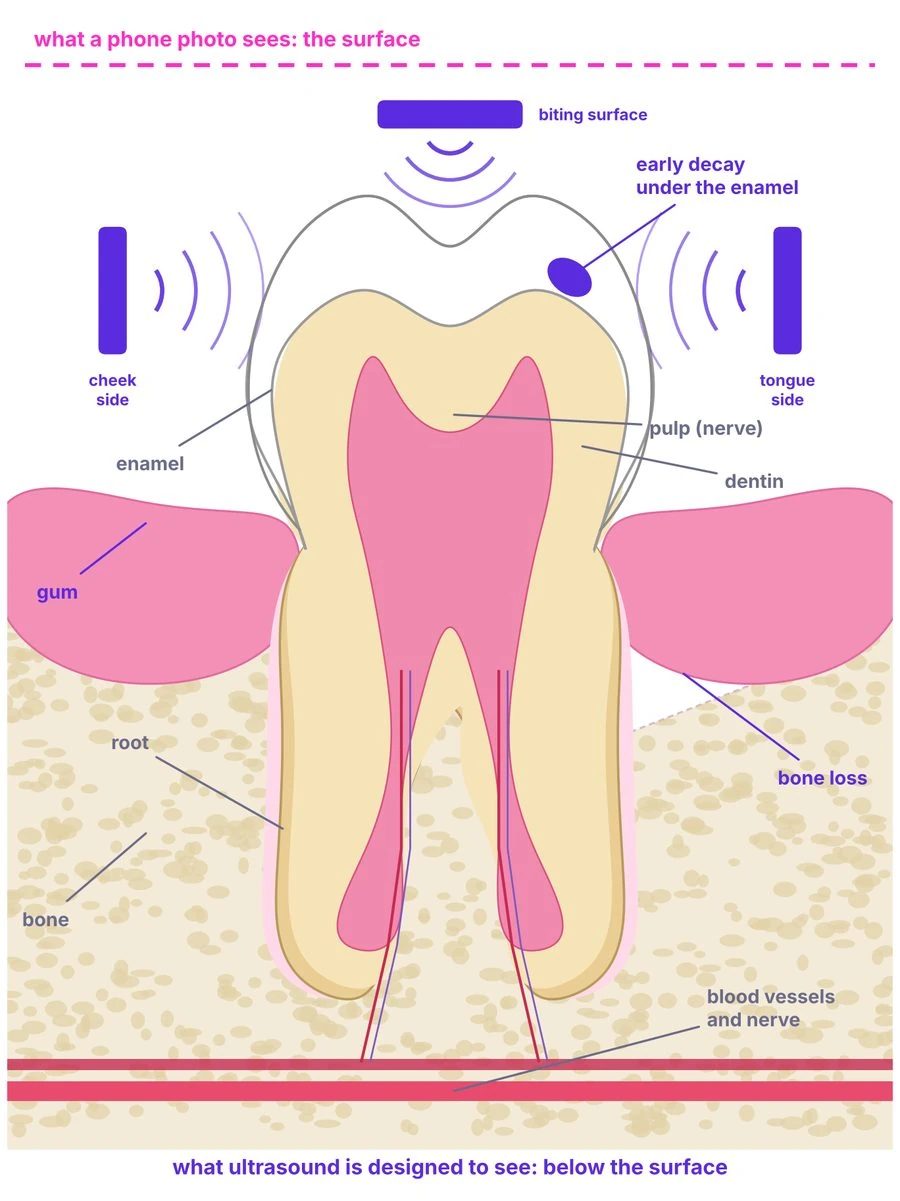
Illustration. Phone-photo monitoring stops at the enamel surface; ultrasound returns an echo from every boundary beneath it.
How dental ultrasound works
Sound in, echoes out, a picture of what lies underneath
1 · A pulse of sound
A sensor sends a short, high-frequency pulse (20–60 MHz for teeth, lower for bone) into the tooth through a thin layer of gel or saliva. The frequencies are far above hearing and carry no ionizing energy.
2 · Every boundary echoes
Wherever the material changes, part of the pulse reflects: enamel to dentin, dentin to pulp, gum to bone, healthy enamel to a softened, demineralized patch. The time each echo takes back gives its depth; its strength says what it hit.
3 · Many angles become a volume
A single probe gives a 2D slice. Sensors on three sides of every tooth, firing together, give multiple views of the same structure, which software reconstructs into a 3D volume, the same principle used in industrial inspection and breast ultrasound tomography.
What X-rays see
Density. A radiograph is a shadow: dense tissue blocks the beam, soft tissue does not. That makes X-rays excellent for bone and large cavities, blind to gum thickness and soft-tissue inflammation, and late to early decay, which must lose 30–40% of its mineral before it shows on film.
What ultrasound sees
Boundaries and stiffness. Ultrasound reflects at every change of material, so it images gums and soft tissue directly, measures bone level and thickness against the gum, resolves enamel and dentin layers, and responds to early demineralization before it becomes a hole. It also reads through metal and ceramic restorations that blind X-rays.
What a phone photo sees
The surface only: alignment, color, visible plaque. Nothing under the enamel or below the gum line.
Watch it happen
One pulse, three echoes, one line of the image
%22%3E%3Crect fill=%22%231E1B3A%22 height=%22240%22 rx=%2210%22 width=%22160%22 x=%220%22 y=%220%22%3E%3C/rect%3E%3Ctext fill=%22%23D8D0FF%22 font-family=%22Outfit,Arial%22 font-size=%2211%22 font-weight=%22700%22 text-anchor=%22middle%22 x=%2280%22 y=%2220%22%3EA-SCAN %C2%B7 echo vs time%3C/text%3E %3Cline stroke=%22%236B6B8A%22 x1=%2220%22 x2=%22150%22 y1=%22220%22 y2=%22220%22%3E%3C/line%3E%3Cline stroke=%22%236B6B8A%22 x1=%2220%22 x2=%2220%22 y1=%2240%22 y2=%22220%22%3E%3C/line%3E %3Crect class=%22b1%22 fill=%22%23FF2EC4%22 height=%220%22 width=%228%22 x=%2244%22 y=%22180%22%3E%3C/rect%3E%3Crect class=%22b2%22 fill=%22%23FF2EC4%22 height=%220%22 width=%228%22 x=%2284%22 y=%22194%22%3E%3C/rect%3E%3Crect class=%22b3%22 fill=%22%23FF2EC4%22 height=%220%22 width=%228%22 x=%22124%22 y=%22206%22%3E%3C/rect%3E %3Ctext fill=%22%23D8D0FF%22 font-family=%22Nunito Sans,Arial%22 font-size=%229%22 text-anchor=%22middle%22 x=%2248%22 y=%22233%22%3E%E2%91%A0%3C/text%3E%3Ctext fill=%22%23D8D0FF%22 font-family=%22Nunito Sans,Arial%22 font-size=%229%22 text-anchor=%22middle%22 x=%2288%22 y=%22233%22%3E%E2%91%A1%3C/text%3E%3Ctext fill=%22%23D8D0FF%22 font-family=%22Nunito Sans,Arial%22 font-size=%229%22 text-anchor=%22middle%22 x=%22128%22 y=%22233%22%3E%E2%91%A2%3C/text%3E%3Ctext fill=%22%236B6B8A%22 font-family=%22Nunito Sans,Arial%22 font-size=%229%22 text-anchor=%22end%22 x=%22150%22 y=%22233%22%3Etime %E2%86%92%3C/text%3E%3C/g%3E %3Ctext fill=%22%236B6B8A%22 font-family=%22Nunito Sans,Arial%22 font-size=%2211%22 text-anchor=%22middle%22 x=%22230%22 y=%22322%22%3Elater echo = deeper boundary %C2%B7 taller echo = bigger material change%3C/text%3E %3C/svg%3E)
1 · Pulse
The sensor fires a microsecond burst of sound into the tooth through gel or saliva.
2 · Echoes
At each boundary (gel→enamel, enamel→dentin, dentin→pulp) part of the pulse reflects back. The bigger the change in material, the stronger the echo.
3 · Trace
The sensor records when each echo arrives. Time becomes depth; a row of these traces becomes a 2D image, and firing from many positions becomes a 3D volume.
Repeat a few thousand times a second across every sensor in the tray and the whole arch is captured in one acquisition.
Schematic animation. Layer thicknesses, timings and echo strengths are illustrative, not to scale. Animation pauses for visitors who prefer reduced motion.
Ultrasound, explained
How ultrasound works: from a vibrating crystal to a measured depth
Medical ultrasound has been used safely for more than 60 years. The physics is simple enough to fit on one page, and it is the same physics inside S-WAVE™.
1 · A crystal that talks and listens
A piezoelectric element changes shape when voltage is applied, producing a pulse of sound at millions of cycles per second (megahertz). The same element then listens: returning pressure waves squeeze it and generate a tiny voltage. One sensor is both loudspeaker and microphone, switching thousands of times a second.
2 · Sound reflects at every boundary
Each tissue has an acoustic impedance, its density times its speed of sound. Where impedance changes, part of the wave reflects and the rest continues. Gel to enamel is a big jump, so a strong echo; enamel to dentin, a smaller one; dentin to pulp, another. A softened, demineralized patch of enamel has a different impedance from healthy enamel, which is why early decay can return an echo before it is a hole.
3 · Time becomes depth
Sound travels at a known speed in each tissue (about 1,540 m/s in soft tissue, far faster in enamel). Measure how long an echo took to return, multiply by the speed, divide by two, and you have the depth of the boundary that produced it. A string of echoes along one line is an A-scan; sweep or array many lines and you have a 2D image (B-mode); stack 2D slices or fire from many positions and you have a 3D volume.
%22 stroke=%22%235B2BE0%22 stroke-width=%223%22 x1=%22380%22 x2=%22380%22 y1=%2240%22 y2=%22100%22%3E%3C/line%3E %3Cline marker-end=%22url(%23ar)%22 stroke=%22%235B2BE0%22 stroke-dasharray=%225 4%22 stroke-width=%222%22 x1=%22380%22 x2=%22380%22 y1=%22100%22 y2=%22170%22%3E%3C/line%3E %3Cline marker-end=%22url(%23ar)%22 stroke=%22%235B2BE0%22 stroke-dasharray=%223 4%22 stroke-width=%221.5%22 x1=%22380%22 x2=%22380%22 y1=%22170%22 y2=%22230%22%3E%3C/line%3E %3Cpath d=%22M386 100 Q 420 70 430 40%22 fill=%22none%22 marker-end=%22url(%23ar)%22 stroke=%22%23FF2EC4%22 stroke-width=%223%22%3E%3C/path%3E %3Cpath d=%22M386 170 Q 450 120 470 40%22 fill=%22none%22 marker-end=%22url(%23ar)%22 stroke=%22%23FF2EC4%22 stroke-width=%222.2%22%3E%3C/path%3E %3Cpath d=%22M386 230 Q 480 160 510 40%22 fill=%22none%22 marker-end=%22url(%23ar)%22 stroke=%22%23FF2EC4%22 stroke-width=%221.5%22%3E%3C/path%3E %3Ctext fill=%22%23FF2EC4%22 font-size=%2211%22 font-weight=%22800%22 x=%22432%22 y=%2256%22%3E%E2%91%A0%3C/text%3E%3Ctext fill=%22%23FF2EC4%22 font-size=%2211%22 font-weight=%22800%22 x=%22472%22 y=%2256%22%3E%E2%91%A1%3C/text%3E%3Ctext fill=%22%23FF2EC4%22 font-size=%2211%22 font-weight=%22800%22 x=%22512%22 y=%2256%22%3E%E2%91%A2%3C/text%3E%3Ctext fill=%22%23FF2EC4%22 font-weight=%22800%22 x=%22445%22 y=%2222%22%3Eechoes back to the sensor%3C/text%3E %3Ctext fill=%22%231E1B3A%22 x=%22560%22 y=%2272%22%3E%E2%91%A0 gel %E2%86%92 enamel: strong echo (big impedance jump)%3C/text%3E %3Ctext fill=%22%231E1B3A%22 x=%22560%22 y=%22140%22%3E%E2%91%A1 enamel %E2%86%92 dentin: boundary echo%3C/text%3E %3Ctext fill=%22%231E1B3A%22 x=%22560%22 y=%22204%22%3E%E2%91%A2 dentin %E2%86%92 pulp: deep echo%3C/text%3E %3Ctext fill=%22%236B6B8A%22 x=%2260%22 y=%22290%22%3Edepth = speed of sound %C3%97 round-trip time %C3%B7 2 %C2%B7 echo strength %E2%88%9D ((Z%E2%82%82%E2%88%92Z%E2%82%81)/(Z%E2%82%82%2BZ%E2%82%81))%C2%B2 %C2%B7 Z = density %C3%97 speed of sound%3C/text%3E %3C/svg%3E)
Frequency sets the trade-off
| Frequency | Typical use | Resolution | Depth |
|---|---|---|---|
| 2–5 MHz | Abdomen, heart, obstetrics | ~0.5–1 mm | 15–25 cm |
| 7–15 MHz | Thyroid, breast, vessels, skin | ~0.1–0.3 mm | 2–6 cm |
| 20–60 MHz | Eye, skin layers, teeth and gums (research) | ~0.03–0.1 mm | a few mm to ~1 cm |
Higher frequency means shorter wavelength and finer detail, but faster absorption and shallower reach. Teeth are small and near the surface, so dentistry can use the high end of the scale, which is where the sub-0.1 mm results in the research library come from.
What the echo also tells you
- Strength: how different the two materials are, the basis for telling healthy from demineralized enamel, or gum from bone.
- Shape: a crack or a rough surface scatters the pulse; a smooth boundary reflects it cleanly.
- Shadowing: behind a strong reflector (a metal filling, dense bone) little sound continues, which is both a limit and a clue.
- Speed of sound itself: measured across a known thickness it reports stiffness and mineral content, the principle of bone-density ultrasound.
Why it is safe to repeat
Ultrasound is mechanical vibration, not ionizing radiation. It deposits no dose and does not break chemical bonds. Its two safety limits are heating and cavitation, which diagnostic devices stay well below under FDA acoustic-output limits (thermal and mechanical index). That is why obstetric scans are repeated throughout pregnancy, and why a monthly dental scan is a reasonable design goal.
Speeds of sound and impedance values are typical literature figures for human tissues and vary with composition and temperature; frequency, resolution and depth ranges are approximate. Diagnostic-ultrasound safety limits refer to FDA acoustic-output guidance for cleared devices; S-WAVE™ must demonstrate compliance in its own testing.
Three dimensions
Why 3D ultrasound changes diagnosis
A 2D ultrasound image is one slice through the body, chosen and angled by whoever holds the probe. A 3D volume contains every slice at once. In the specialties that adopted it, three things changed: measurements, reproducibility and who can perform the scan.
Measurements become volumes
In 2D, a volume is estimated from a diameter and a formula. In 3D it is measured directly. Three-dimensional echocardiography measures left-ventricular volume and ejection fraction with less variability than 2D and agrees more closely with cardiac MRI, which is why guidelines prefer it when available. The same shift applies to a bone defect around a tooth or an implant: a volume, not a line on a radiograph.
Any plane, after the fact
With a volume stored, a clinician can cut it in any plane later, including planes a probe could never reach physically, such as the coronal plane of the uterus in 3D gynecologic ultrasound. For a tooth, that means the cheek-side, tongue-side and biting-surface views of the same structure, registered together, from one acquisition.
Less dependence on the operator
In 2D, image quality and measurement accuracy depend on probe angle and hand skill. Volume acquisition fixes the geometry, so the same scan can be taken by a less-trained operator and read by an expert elsewhere. Automated fetal-volume acquisition and AI-guided cardiac scanning by novices (FDA-authorized in 2020) are the medical precedents; S-WAVE™’s fixed tray is the dental version of the same idea.
Where 3D ultrasound is used today
| Field | What 3D added |
|---|---|
| Obstetrics | Surface rendering of the fetal face and spine; standardized volume acquisition of the fetal heart and brain for later expert review. |
| Cardiology | True chamber volumes and valve anatomy; guidance of structural-heart procedures. |
| Breast imaging | Automated whole-breast 3D ultrasound for dense breasts; ultrasound tomography (SoftVue, FDA PMA 2021) rings the breast with transducers to reconstruct a full volume without compression or radiation. |
| Gynecology | Coronal-plane views of the uterus for congenital anomalies and IUD position. |
| Vascular and musculoskeletal | Plaque volume in carotid arteries; tendon and nerve mapping. |
| Image-guided surgery | Intra-operative volumes registered to CT/MRI plans, updated without radiation. |
What this means for a mouth
- Comparable scans. A fixed-geometry 3D volume taken this month can be registered to last month’s. Change, not a single snapshot, is the diagnostic signal: a 0.2 mm shift in bone level is invisible on one image and obvious across six.
- Whole-arch context. One tooth’s bone loss is read against its neighbours and the opposing arch, as a periodontist does chairside.
- Sub-surface and surface together. The same volume that holds the bone crest also holds the enamel surface, so tooth movement during aligner treatment and the bone around the moving root are in one data set.
- Ready for AI. Volumes from a fixed tray are far more uniform than hand-held sweeps, which is what segmentation and change-detection models need to train on.
- No dose budget. Serial imaging is the whole point, and only a non-ionizing method can be repeated monthly without a dose conversation.
ionizing dose, however many times the scan is repeated
sides of every tooth captured in one acquisition, by design
a year, the monitoring cadence S-WAVE™ is designed for, versus twice-yearly X-rays
Medical examples describe FDA-cleared or approved products and published clinical practice in other specialties; they are not KronosMD products and do not predict S-WAVE™’s performance. 3D full-arch dental ultrasound in people has not been demonstrated; see Limits and open questions below. Statements about S-WAVE™ describe design intent.
Proof of concept in medicine
3D ultrasound has been in medicine for forty years. Ask any parent.
The 3D ultrasound picture of a baby’s face is the most familiar medical image in the world. It was first made in 1986, sold commercially in 1989 and became routine in the 1990s, because it is safe to repeat, the volume can be reviewed in any plane after the scan, and it shows surfaces and structure that a single 2D slice cannot. S-WAVE™ is designed to bring that same forty-year-old principle to teeth, gums and bone.
How 3D ultrasound grew up in obstetrics
Kazunori Baba (University of Tokyo) reports a 3D ultrasound system in 1984 and, in 1986, the first 3D images of a fetus, built by processing 2D scans on a mini-computer.
Kretztechnik’s Combison 330 (Zipf, Austria) reaches the market: the first 3D ultrasound system sold to clinics.
Kuo, Chang and Wu (Taiwan) image the fetal face, cerebellum and cervical vertebrae in 3D; Feichtinger (Vienna) shows 3D transvaginal images of 10-week embryos; Kretztechnik launches the Voluson 530D.
Merz (Mainz) demonstrates multiplanar, surface and transparent views for facial clefts and skeletal anomalies; Jurkovic (London) shows 3D accuracy for uterine anomalies.
Baba reports real-time 3D in The Lancet; two groups publish 4D fetal echocardiography; the first English-language 3D ultrasound textbook appears.
Matrix-array 3D probes become commercial; the First World Congress on 3D Ultrasound in Obstetrics and Gynecology is held in Mainz; ISUOG forms its 3D focus group.
3D/4D fetal ultrasound is standard equipment in obstetric units worldwide, repeated through pregnancy because it deposits no ionizing dose. The same volume-imaging principle has since been cleared by FDA for the heart, breast and thyroid.
What the pregnancy precedent proves
- Safety over decades. Pregnant women have been scanned, and rescanned, with 3D ultrasound since the 1980s; it is the modality chosen precisely because it is non-ionizing.
- Volumes change diagnosis. Surface rendering made facial clefts and skeletal anomalies visible in a way 2D never did; multiplanar review let specialists read a scan taken by someone else.
- From research to routine in a decade. First images 1986, first product 1989, world congress 1997, standard of care by the 2000s.
- Hardware is the easy part now. Matrix-array probes and software reconstruction are mature; what S-WAVE™ adds is a fixed intraoral geometry and sensors tuned for enamel and bone.
What is different about a mouth
- A fetus floats in fluid, the ideal acoustic window; teeth sit in air and saliva, so S-WAVE™ needs a tray that keeps every sensor coupled.
- Obstetric probes work at 2–8 MHz to reach deep; teeth are shallow and need 20–60 MHz for sub-millimeter detail.
- Enamel is the hardest tissue in the body and reflects strongly, which is both the signal and the challenge for seeing beneath it.
- And the operator: an obstetric 3D scan is taken by a trained sonographer; S-WAVE™ is designed so the patient takes it at home.
The precedent keeps spreading. The same approach, 3D volumes reconstructed in software from standard ultrasound hardware with AI measurement, was FDA-cleared for the thyroid in September 2024 (PIUR tUS Infinity, 510(k) K240036), for whole-breast imaging, and for 3D echocardiography, which guidelines now prefer for heart-chamber volumes. Each is a specialty that replaced an estimate with a measured volume.
History per the clinical chronology at ob-ultrasound.net (Woo J.) and the cited primary reports; product and company names are trademarks of their owners, used for identification only, and none is affiliated with KronosMD. Obstetric and other medical 3D ultrasound devices are cleared products in other specialties; their safety and performance records do not predict S-WAVE™’s, which has not been tested in people. Statements about S-WAVE™ describe design intent.
Precision
Measured against the gold standards, to a fraction of a millimeter
The numbers below come from peer-reviewed studies that compared research-grade dental ultrasound with the reference method for each structure: micro-CT, CBCT, histology or physical probing.
| Structure | Ultrasound result | Compared with | Study |
|---|---|---|---|
| Alveolar bone level | Within 0.07 mm; inter-rater ICC 0.97 (vs 0.69 for CBCT) | CBCT | Nguyen, Le et al., 2023 |
| Alveolar bone, in vivo | Within 0.18–0.31 mm; bone thickness within 0.05 mm | Micro-CT | Wang, Le et al., 2026 |
| Gingival (gum) thickness | Within ~0.2 mm, ICC up to 0.87, no probing | Invasive probing | Alizad-Rahvar et al., 2024 |
| Enamel thickness | r = 0.97 | Histology | OOOO, 2005 |
| Early enamel lesions | Demineralized enamel separated; depth matched | Micro-CT | Kim et al., 2019 |
| Caries in patients | 82% sensitivity (bitewing X-ray: 75%) | Clinical reference | Matalon et al., 2007 |
| Cracks under restorations | Cracked vs intact distinguished “unequivocally” | Histology | Culjat et al., 2005 |
bone-level agreement with CBCT, with better reproducibility than CBCT itself
caries sensitivity, ultrasound vs bitewing X-ray, in 47 adults
gum thickness without a probe, in 1,360 sites
Studies used research-grade, probe-based ultrasound systems operated by clinicians, not S-WAVE™. They support the physics and clinical value of dental ultrasound and are not evidence of S-WAVE™’s performance. Summaries are KronosMD’s reading of the published abstracts.
Radiation
Dental X-rays are low dose. Ultrasound is no dose.
Dental radiographs are among the smallest medical exposures, and dentists manage them carefully under the ALARA principle. The point is not that X-rays are dangerous; it is that a monthly check cannot be done with them, and ultrasound removes the question entirely.
Each dot = 5 µSv, about one bitewing. The dashed circle is zero: ultrasound is mechanical sound, not ionizing radiation.
Effective dose per examination; CBCT ranges vary widely by device and field of view.
Why this matters for monitoring
A bitewing every six months is fine. A bitewing every month, for years, for a child in aligners, is not something any dentist would prescribe. Monitoring between visits needs an imaging method you can repeat without limit, and only non-ionizing methods qualify.
What S-WAVE™ is designed to do with that freedom
Scan every month, compare each scan with the last, and alert a dentist only when something changes. No dose budget, no office visit, no operator.
Dose figures: Health Physics Society summary of Ludlow et al. 2008 (bitewing 5 µSv; panoramic 14–24 µSv; full-mouth series 35–171 µSv); NCRP natural background ~3,100 µSv/year; CBCT ranges per published surveys (Ludlow et al. 2015) vary from tens to hundreds of µSv by field of view. Ultrasound is non-ionizing; diagnostic ultrasound carries its own safety limits on acoustic output, which S-WAVE™ testing must meet.
Limits and open questions
What the research does not yet show, and how we plan to test it
No study has imaged a full arch in 3D in a person
Every 3D attempt in the literature used a single swept probe on a phantom, a few teeth or an implant model. The bench prototype’s full-arch surface is, to our knowledge, rarer than anything published, and it has not been reproduced in a mouth.
Consumer use is untested
Published results come from clinicians operating research systems. Whether a lay user can seat a tray and obtain a usable scan is a human-factors question that testing must answer.
Saliva, air and movement
Ultrasound needs continuous contact. A fixed tray with a conformable couplant is the design answer; its performance across mouths, braces and restorations has to be demonstrated.
AI accuracy
The scan-comparison software does not exist yet. Its standalone performance and its clinical accuracy against reference imaging are part of the FDA testing plan.
Planned validation path
Accuracy of the prototype against micro-CT on extracted teeth and models.
Ask FDA to confirm the pathway and the testing plan (Q1 2027 target).
Acoustic output, biocompatibility, software V&V, AI standalone performance, lay-user human factors.
S-WAVE™ scans compared with reference imaging in people, as FDA requires.
S-WAVE™ is in development, has not been tested in people and is not cleared or approved by the FDA. Target dates are estimates and may be delayed; the FDA could require more testing than we expect, or may never authorize S-WAVE™.
Dental imaging without radiation, from home.
Questions about S-WAVE™, the research or a collaboration? Our team is here to help.